
Dow Theory: The Definitive Beginner’s Guide to Market Trends, Structure, and Price Action
Every modern technical analysis framework—from classical Japanese Candlesticks and Support/Resistance mapping to Elliott Wave Theory, Wyckoff accumulation cycles, and contemporary Smart Money Concepts (SMC)—shares a single intellectual ancestor: Dow Theory.
Formulated at the turn of the 20th century, Dow Theory remains the foundational bedrock of technical market analysis. It provides an objective, time-tested lens for answering the most critical question in financial speculation: What is the true underlying direction of the broad market, and when has that direction definitively changed?
This comprehensive guide breaks down the historical origin, the six core tenets, the mechanics of market phases, volume confirmation rules, critical flaws, and step-by-step application frameworks to trade modern equity and derivative markets using pure Dow principles.
1. Historical Foundations: Who Was Charles H. Dow?
Charles Henry Dow (1851–1902) was an American financial journalist, market researcher, and co-founder of Dow Jones & Company alongside Edward Jones and Charles Bergstresser. In 1889, Dow founded The Wall Street Journal, using its editorial pages to communicate his observations on equity price behavior and economic momentum.
From Economic Barometer to Trading System
Dow never intended his observations to serve as an intraday trading system or a mechanical scheme for quick profits. Instead, he viewed the stock market as an infallible forward-looking barometer of the underlying health of the economy.
Dow reasoned that because public companies reflect real-time enterprise profits, supply chains, and consumer demand, aggregate stock prices systematically discount economic expansions and recessions months before they manifest in official government data.
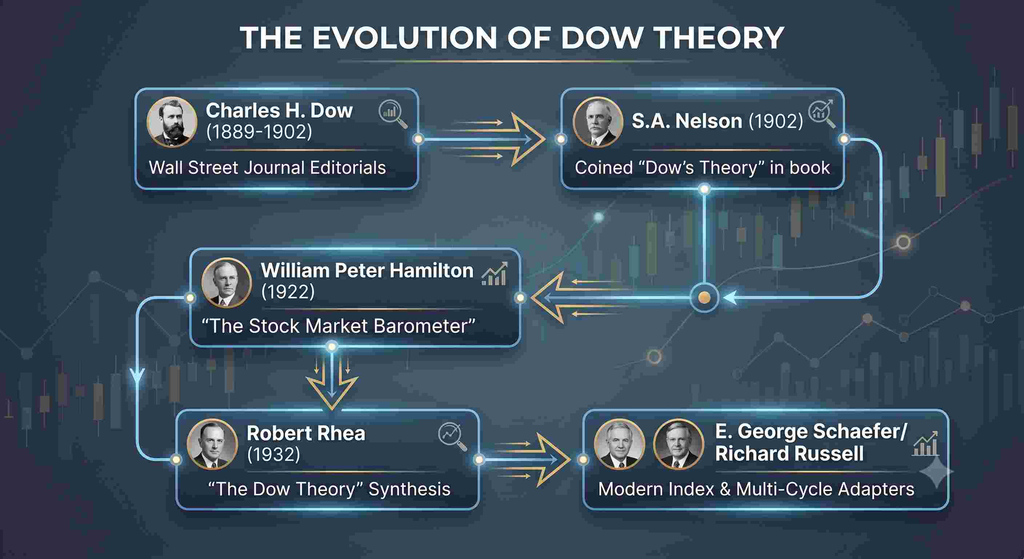
Dow never authored a single, consolidated book outlining his complete framework. Following his death in 1902, several market analysts formalized his scattered editorials into what we recognize today as Dow Theory:
- S.A. Nelson (1902): Published The ABC of Wall Street, which first popularized the phrase “Dow’s Theory.”
- William Peter Hamilton (1922): Succeeded Dow as editor of The Wall Street Journal and authored The Stock Market Barometer, providing rigorous historical case studies of Dow’s trend principles.
- Robert Rhea (1932): Systematized the philosophy during the Great Depression in his seminal work, The Dow Theory, cementing the precise rules for index confirmation, peak-and-trough classification, and volume behavior.
- E. George Schaefer & Richard Russell (1950s–2000s): Refined the application of Dow Theory across postwar macro cycles and long-term secular bull and bear markets.
2. The Six Core Tenets of Dow Theory
Dow Theory is anchored by six non-negotiable principles. Together, they form a cohesive philosophical and mechanical model of market dynamics.
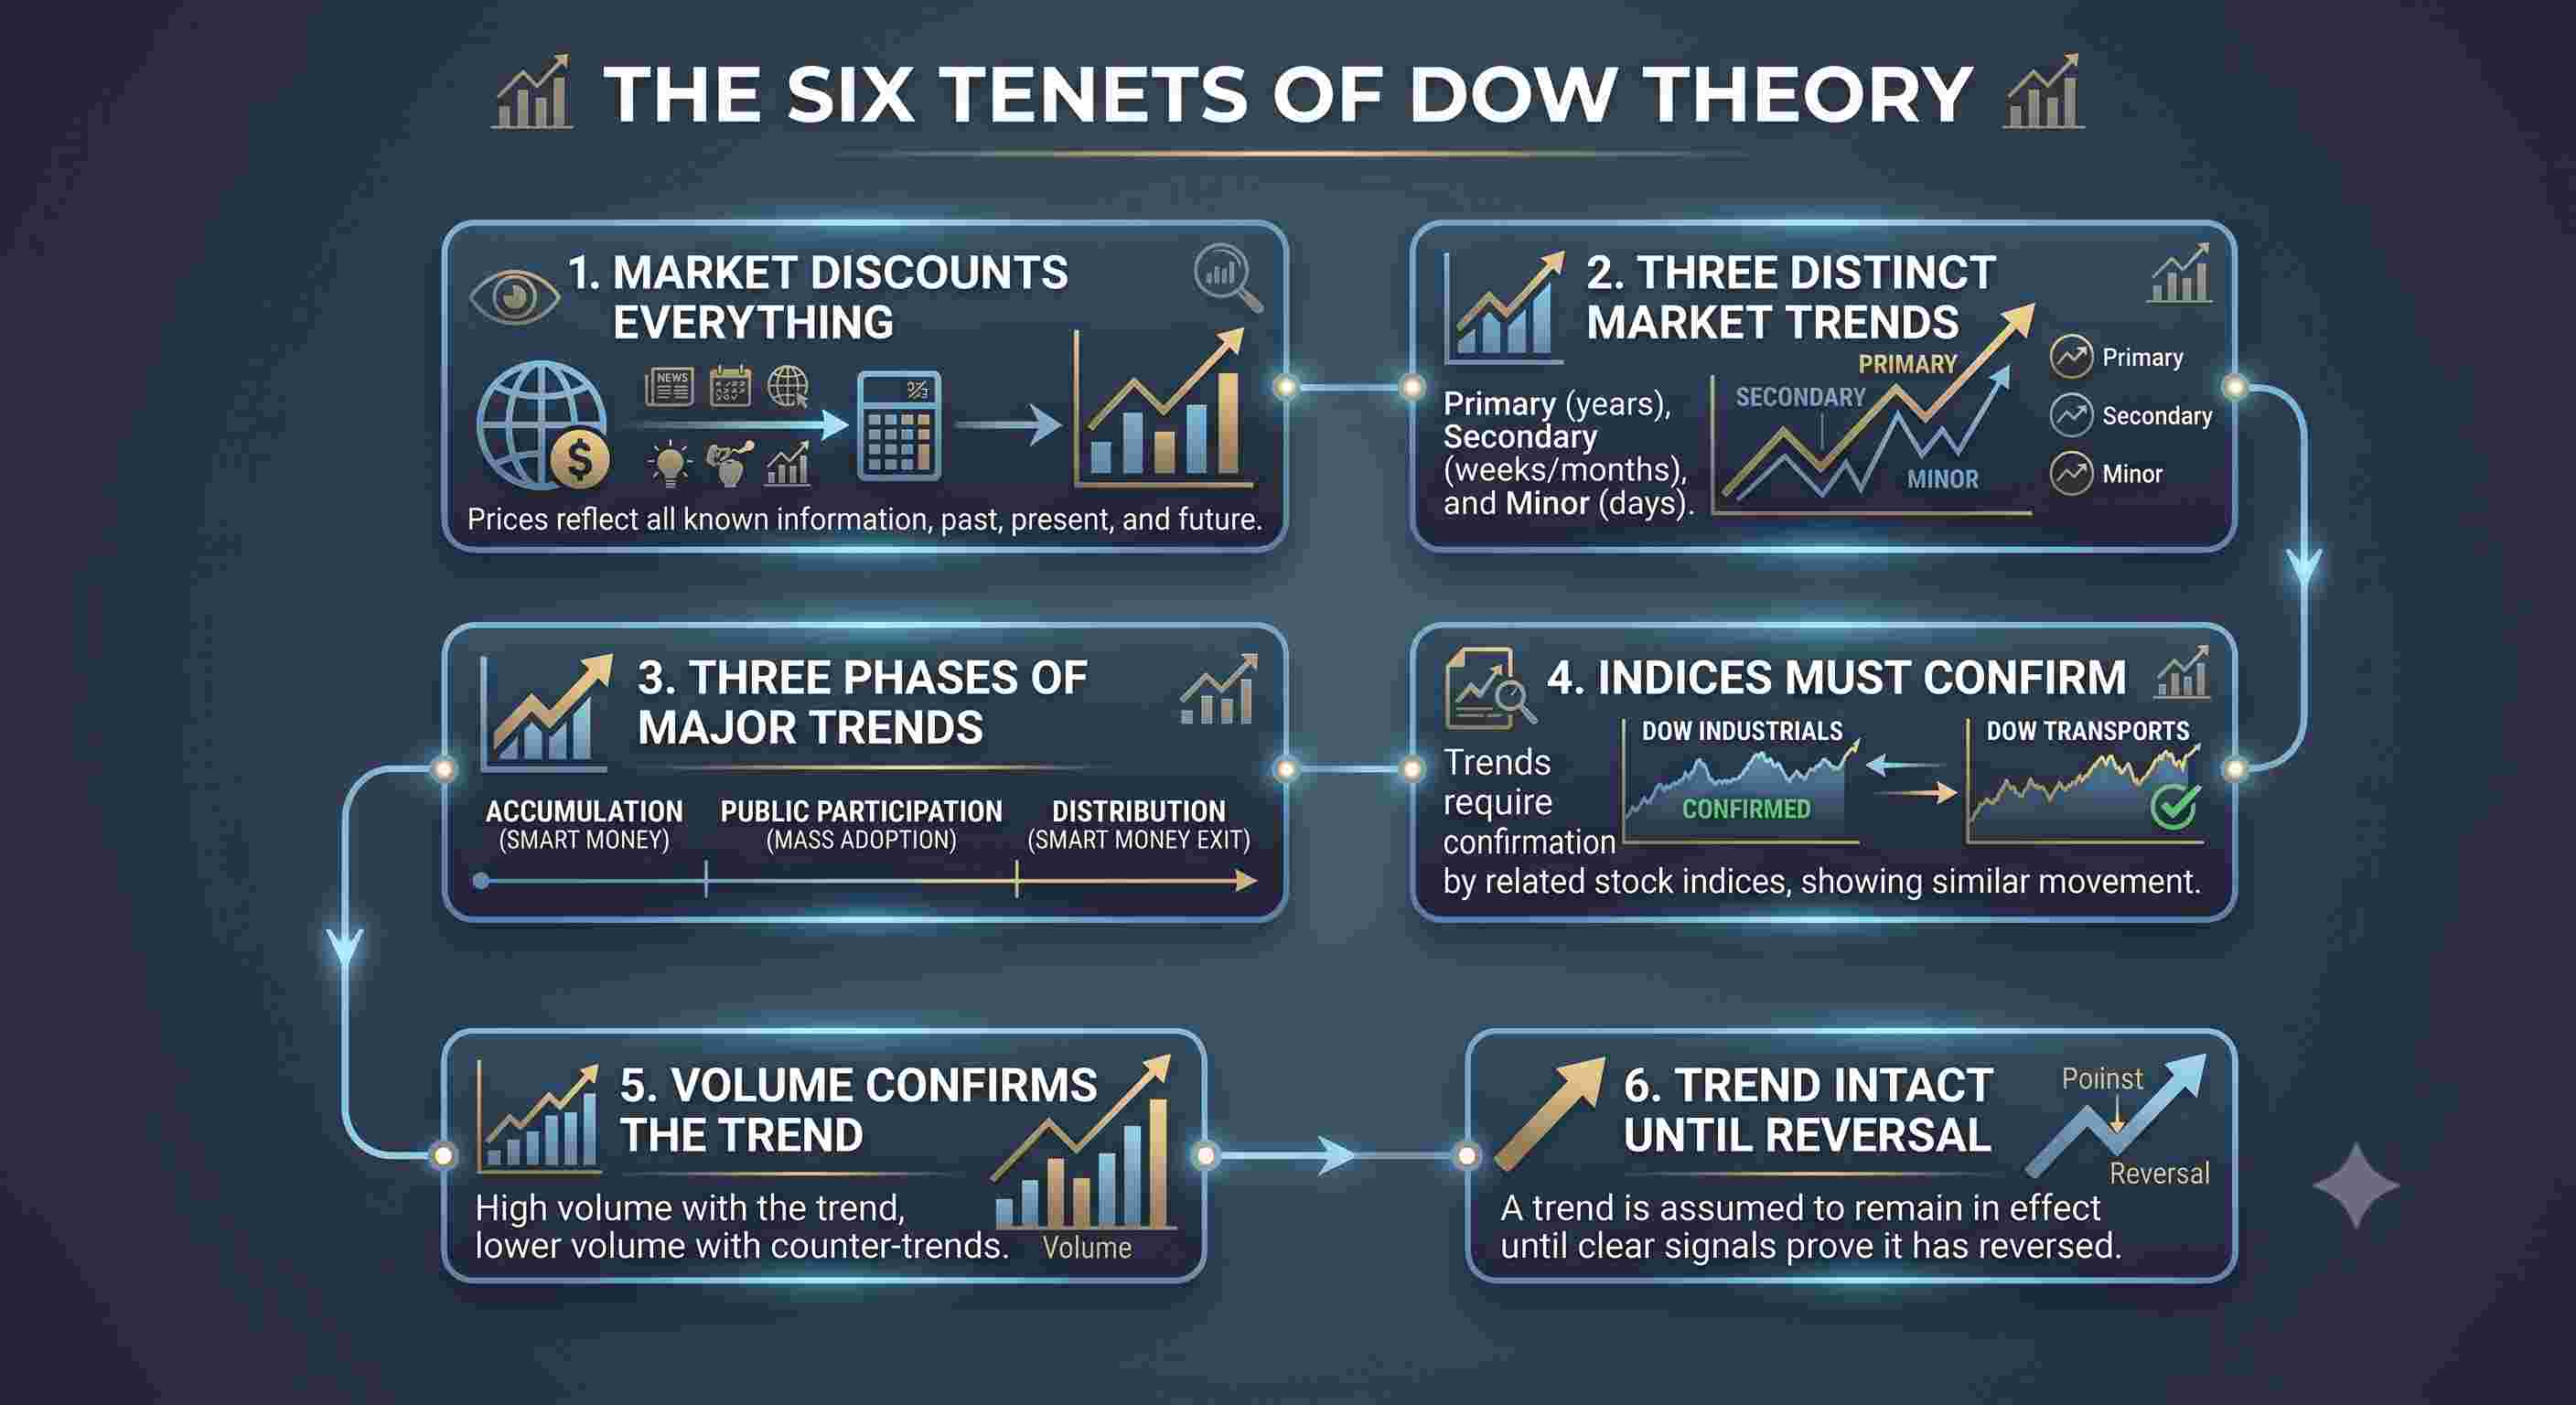
Tenet 1: The Market Discounts Everything (The Efficient Price Engine)
Dow Theory asserts that the closing price of an asset or broad market index reflects the collective sum of all available information, expectations, hopes, fears, and institutional positioning.
- Macro Factors Discounted: Interest rate adjustments, inflation data, geopolitical conflict, natural disasters, corporate earnings, and election outcomes are instantly processed and reflected in current price levels.
- Psychological Reality: Even purely emotional reactions (such as panic selling or manic speculation) are captured in the closing price.
- Practical Implication: Attempting to predict market direction by analyzing lagging news headlines is inferior to analyzing aggregate price structure itself. Price leads the narrative; news merely rationalizes the move after the fact.
Tenet 2: The Market Has Three Distinct Trends
Dow classified market movements into three distinct temporal categories, famously comparing them to the ocean: Tides, Waves, and Ripples.
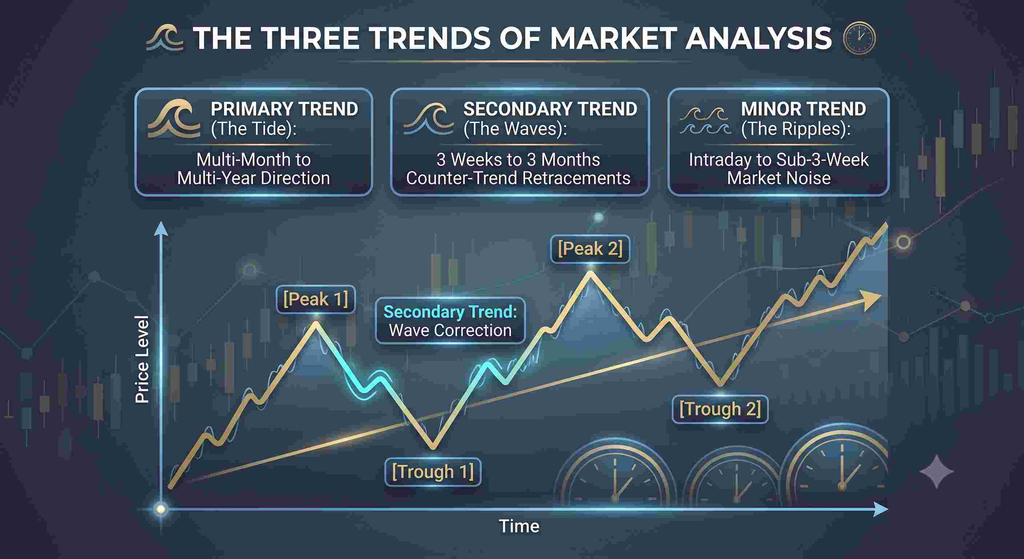
1. The Primary Trend (The Ocean Tide)
- Duration: Typically lasts from one year to several years (though it can occasionally span 9 to 12 months in fast modern cycles).
- Significance: Represents the broad, overarching direction of the market (Secular Bull or Secular Bear). Institutional capital positions primarily with the Primary Trend.
- Characteristics: Accounts for the vast majority of total capital appreciation or loss across economic cycles.
2. The Secondary Trend (The Waves)
- Duration: Lasts anywhere from three weeks to three months (occasionally up to six months).
- Significance: Represents corrective reactions against the Primary Trend (e.g., intermediate corrections in a bull market, or sharp bear-market counter-trend rallies).
- Characteristics: Typically retraces between 33% to 66% (one-third to two-thirds) of the preceding primary swing, with 50% retracements being the historical norm. Secondary trends frequently trap aggressive retail traders who confuse temporary pullbacks with structural trend reversals.
3. The Minor Trend (The Ripples)
- Duration: Lasts from a few hours up to less than three weeks.
- Significance: Represents short-term fluctuations, daily noise, and emotional order flow.
- Characteristics: Highly susceptible to market manipulation, localized short-squeezes, and erratic news spikes. Dow cautioned that trading decisions should never be based solely on Minor Trends, as they provide little structural predictive value.
Tenet 3: Primary Trends Move Through Three Distinct Phases
Primary Bull and Bear markets do not advance or decline in straight lines. They progress through clear structural and psychological stages reflecting the transfer of shares between informed institutional capital (“Smart Money”) and the uninformed public.
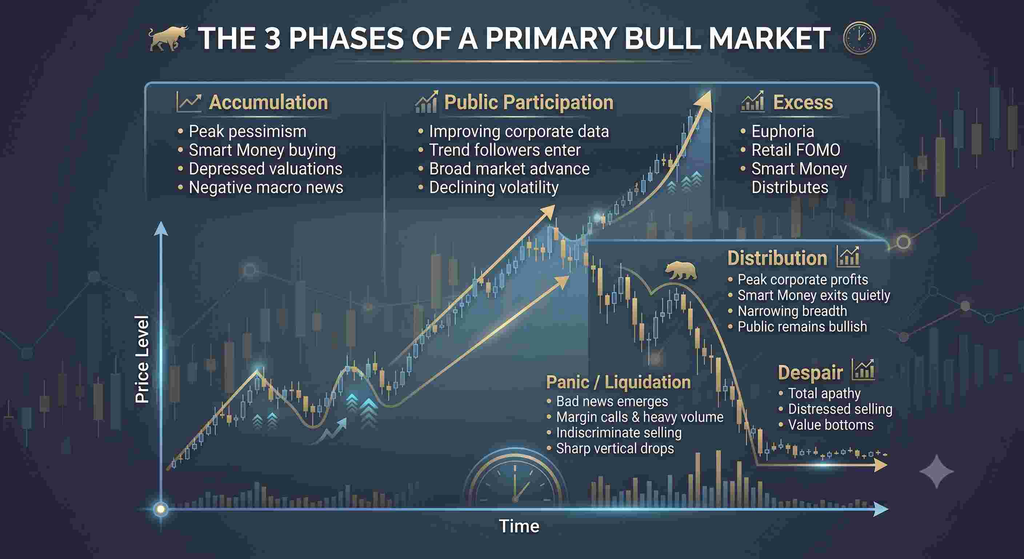
The Primary Bull Market Lifecycle
- Accumulation Phase: Occurs at the tail end of a severe bear market when valuations are depressed and general sentiment is bleak. Astute institutional investors begin absorbing supply from distressed sellers. Economic headlines remain negative, but asset prices stop making new lows.
- Public Participation (Markup) Phase: Business conditions begin improving, earnings recover, and technical trend-following strategies buy aggressively. This represents the longest, smoothest, and most profitable segment of a bull market.
- Distribution (Excess/Euphoria) Phase: Speculative frenzy grips the broader public. Media headlines turn wildly bullish, valuations detach from historical fundamentals, and novice retail traders deploy leveraged capital. While the public aggressively buys breakout patterns, the institutional capital that accumulated in Phase 1 methodically offloads inventory.
The Primary Bear Market Lifecycle
- Distribution Phase: Occurs during the final stages of the bull market. Smart money unwinds remaining long inventory into strong retail buying. Price action becomes choppy and volatile near all-time highs.
- Panic (Liquidation) Phase: Buyers evaporate, earnings revisions drop, and cascading margin calls trigger forced selling. Downward price swings become nearly vertical, accompanied by elevated volume.
- Despair (Discouraged Selling) Phase: The intense panic subsides into prolonged, grinding downward drift. Disillusioned market participants liquidate high-quality holdings simply out of exhaustion. Ironically, this broad liquidation marks the beginning of the next Accumulation Phase.
Tenet 4: The Averages Must Confirm Each Other
Dow argued that a healthy economic trend cannot occur in isolation. To confirm a genuine primary advance or decline, multiple complementary market indices must confirm each other’s price structures.
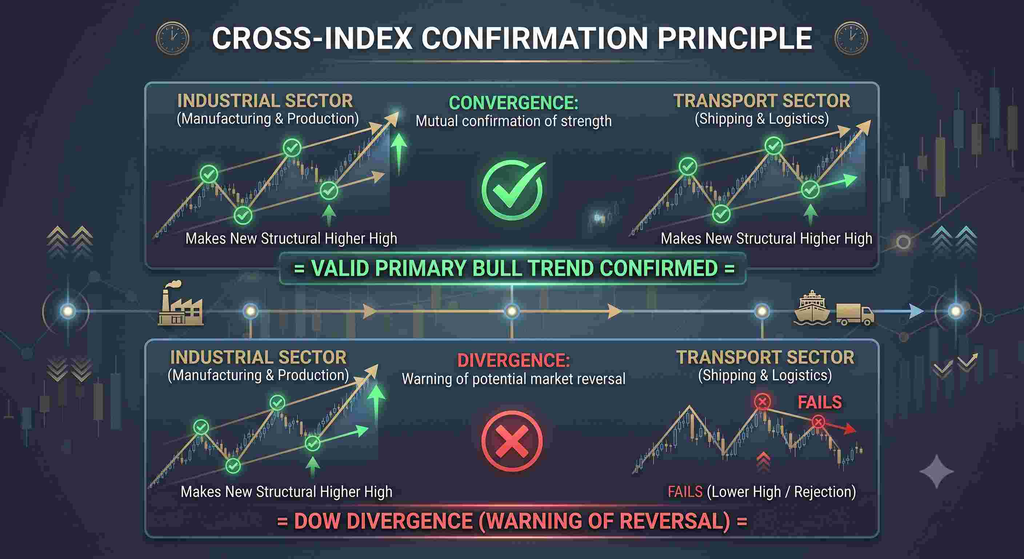
- Original Historical Rationale: Dow tracked the Dow Jones Industrial Average (DJIA) (representing manufacturers producing physical goods) and the Dow Jones Railroad (now Transportation) Average (DJTA) (representing the transport companies delivering those goods to market). If manufacturers were making record products (DJIA making new highs), but transport firms were not moving those goods (DJTA failing to make new highs), the economic expansion was an illusion.
- The Confirmation Rule: A breakout to a new high in one index is unconfirmed and suspect until the companion index also breaks out above its corresponding peak.
- Non-Confirmation (Divergence): When one index achieves a new high while the companion index prints a lower high, a Dow Divergence occurs, warning that the primary trend is losing internal momentum.
Tenet 5: Volume Must Confirm the Trend
While closing prices remain the ultimate authority in Dow Theory, volume serves as the vital secondary indicator of institutional participation.
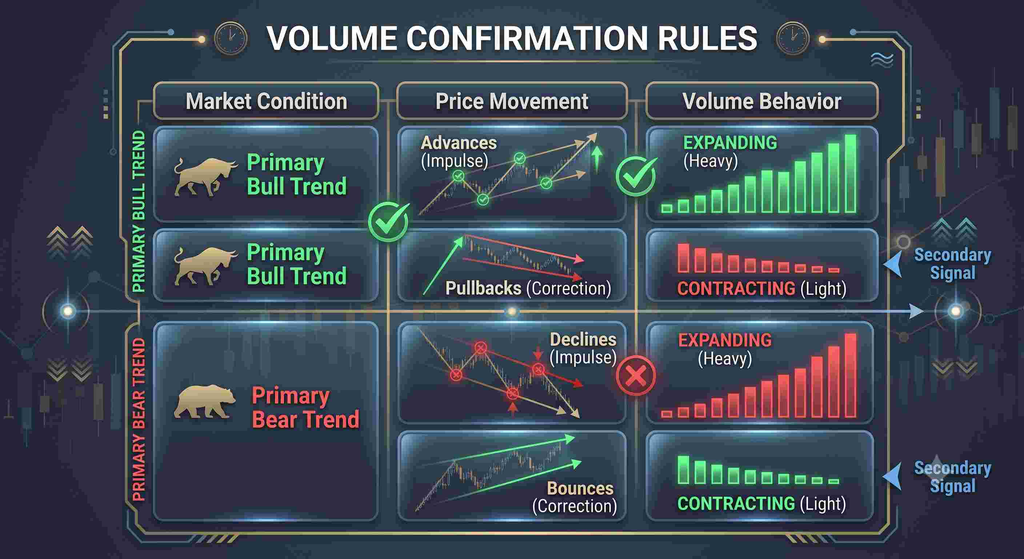
- In an Uptrend: Volume should increase during upward price advances (showing aggressive institutional demand) and decrease during downward secondary corrections (showing a lack of structural selling pressure).
- In a Downtrend: Volume should increase during downward price legs (showing active liquidation) and dry up during counter-trend rallies (showing weak retail buying).
- Volume Divergence Warning: If an index pushes to new marginal highs on visibly diminishing volume, it signals buying exhaustion and warns of an impending structural breakdown.
Tenet 6: A Trend Is Assumed to Remain Intact Until Definite Reversal Signals Occur
One of the most expensive mistakes traders make is attempting to predict tops and bottoms ahead of structural confirmation. Dow Theory holds that a trend in motion is far more likely to continue than to reverse.
- The Law of Inertia: Just as physical objects resist changes in motion, financial trends maintain their primary trajectory until opposing order flow creates an objective break in market structure.
- No Preemptive Exits: Pullbacks, minor consolidations, and negative headlines do not constitute a reversal. A bull market remains active until the market establishes an unambiguous pattern of Lower Highs followed by a breakdown below the prior Higher Low.
3. Market Structure Mechanics: Peaks and Troughs
To trade Dow Theory objectively, subjective chart interpretation must be replaced with mechanical price structure: the systematic classification of Peaks (Swing Highs) and Troughs (Swing Lows).
Anatomy of an Uptrend
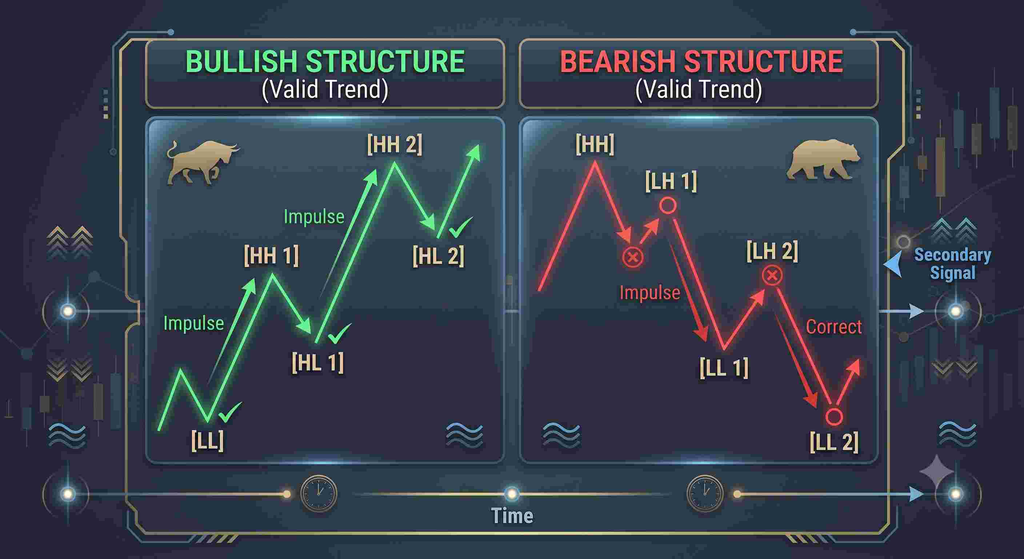
An uptrend is mechanically defined as an unbroken sequence of:
- Higher Highs (HH): Every successive impulse swing closes above the peak of the preceding swing.
- Higher Lows (HL): Every successive corrective decline terminates and reverses above the trough of the preceding correction.
As long as incoming pullbacks hold above the most recently established Higher Low, the Primary Uptrend remains structurally valid.
Anatomy of a Downtrend
A downtrend is mechanically defined as an unbroken sequence of:
- Lower Highs (LH): Every successive counter-trend rally terminates below the peak of the preceding swing.
- Lower Lows (LL): Every successive impulse decline closes below the trough of the preceding decline.
The Two Mechanical Reversal Models
A primary structural reversal requires a multi-step break of market structure. Dow Theory recognizes two classic reversal patterns: Failure Swings and Non-Failure Swings.
1. The Failure Swing Reversal (Highest Probability)
A Failure Swing occurs when the market attempts to continue the prevailing trend but fails to reach a new extreme, demonstrating structural exhaustion before breaking support.
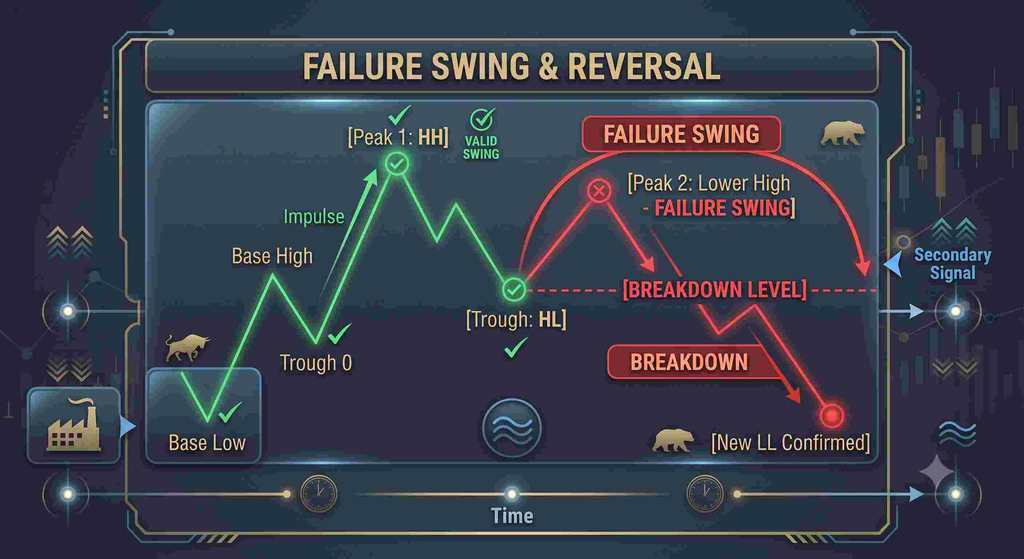
- Step 1: In an established uptrend, price rallies to a new high (Peak 1 / HH).
- Step 2: A normal secondary correction pulls back to form a trough (Higher Low).
- Step 3: The next rally fails to surpass Peak 1, rolling over early to print a Lower High (Peak 2). This is the “Failure.”
- Step 4 (The Trigger): Price rolls over and closes below the intervening Higher Low.
- Confirmation: The primary uptrend is dead, and a new primary downtrend is officially confirmed.
2. The Non-Failure Swing Reversal
In a Non-Failure Swing, price successfully makes a new high, but the subsequent decline penetrates straight through the previous Higher Low, resetting the structural trend.
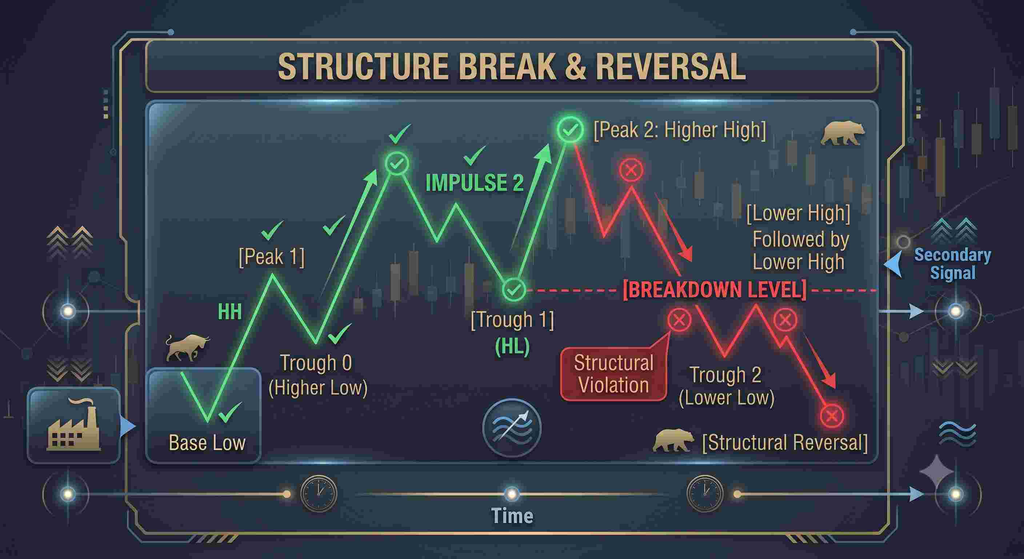
- Step 1: Price pushes to a fresh Higher High (Peak 2).
- Step 2: The subsequent decline drops with unusual momentum, closing directly below the prior Trough 1.
- Step 3: A secondary bounce forms a clear Lower High.
- Step 4 (The Trigger): A breakdown below the newly established low confirms the structural transition from bull to bear.
4. Dow Theory vs. Modern Technical Frameworks
Dow Theory is the direct foundation for most modern price-action systems. The following table contrasts Dow Theory with the frameworks that evolved from it:
| Feature / Metric | Classic Dow Theory | Elliott Wave Theory | Wyckoff Method | Smart Money Concepts (SMC) |
| Primary Focus | Broad Market Direction & Trend Invalidation | Precise Fractal Wave Counts & Targets | Volume Accumulation & Distribution Springs | Liquidity Sweeps & Institutional Order Blocks |
| Timeframe Application | Daily, Weekly, and Monthly Charts | Fractal (Tick charts to Secular Supercycles) | Daily, Intraday, & Multi-Year Phases | Intraday (1-min, 5-min, 15-min, 1-Hour) |
| Core Trend Metric | Confirmed Higher Highs / Higher Lows across Averages | 5-Wave Impulse / 3-Wave Correction Sequences | Composite Operator Inventory Campaigns | Change of Character (CHoCH) & Break of Structure (BOS) |
| Confirmation Metric | Cross-Index Confirmation + Volume Expansion | Strict Wave Invalidation Rules + Fibonacci Ratios | Volume Spread Analysis (Effort vs. Result) | Fair Value Gaps (FVG) & Liquidity Pools |
| Predictive Stance | Reactive (Trades structural confirmation) | Predictive (Projects wave targets & pivots) | Anticipatory (Identifies accumulation tests) | Reactive/Execution-based around liquidity sweeps |
| Subjectivity | Low (Strict binary high/low closes) | High (Multiple valid alternate counts) | Moderate (Requires reading supply/demand spread) | Moderate to High (Subjective block identification) |
5. Practical Implementation: A Step-by-Step Modern Trading Blueprint
Modern retail and institutional traders adapt Dow Theory to trade individual equities, index futures, and options. Below is an institutional-grade 5-step operational blueprint for applying Dow Theory in today’s markets.
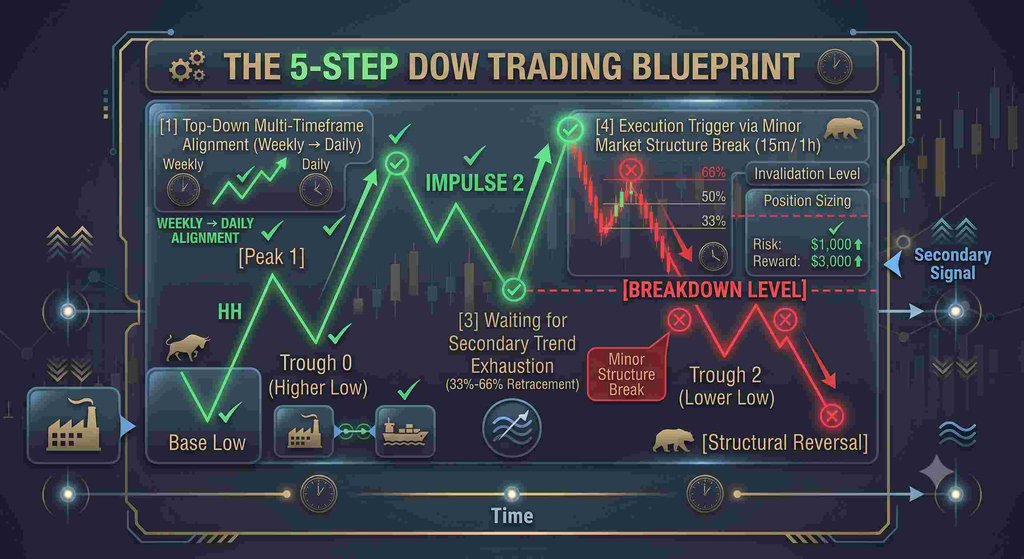
Step 1: Top-Down Multi-Timeframe Alignment
Never evaluate a single chart in isolation. Establish structural alignment across three distinct timeframes:
- Weekly Chart (Primary Trend): Map out the major multi-month Peaks and Troughs. Classify the macro state: Is the market printing Weekly Higher Highs and Higher Lows? If yes, take long positions exclusively.
- Daily Chart (Secondary Trend): Identify counter-trend pullbacks. Look for corrections that have retraced between 38.2% and 61.8% of the previous primary impulse wave.
- 60-Minute / 15-Minute Chart (Minor Trend): Locate the precise execution trigger as the lower-timeframe structure realigns with the primary trend.
Step 2: Cross-Market Confirmation Verification
Before deploying capital in a specific asset or index, verify broader market health:
- For US Markets: Check that the S&P 500 ($SPX), Nasdaq 100 ($NDX), and Dow Jones Industrials ($DJI) are printing confirmed swing highs simultaneously.
- For Indian Markets: Check that the Nifty 50 and Nifty Bank (or broader Nifty 500) are moving in tandem.
- Sector Confirmation: If buying a leading technology stock, verify that the broad Technology Sector Index is simultaneously breaking above its prior swing high.
Step 3: Identify Secondary Trend Exhaustion
Rather than chasing breakout candles at the top of an impulse leg, wait for a Secondary Correction to develop:
- Allow the asset to pull back against the primary trend for 5 to 15 trading sessions.
- Verify that volume contracts noticeably as price drops toward the prior Daily Higher Low.
- Monitor key horizontal support levels (the prior broken swing high turning into support).
Step 4: Execution Trigger on Minor Structure Break
Once the secondary correction approaches the support area, drop to the 1-Hour chart to spot a Minor Trend Failure Swing:
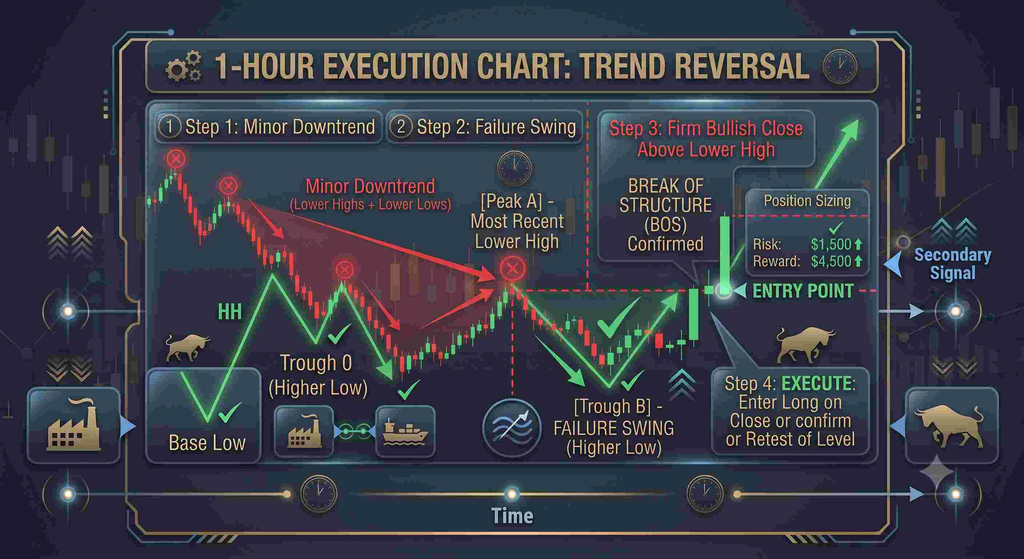
1-Hour Execution Chart:
  1. Price descends in a minor downtrend (Lower Highs + Lower Lows).
  2. Price prints a Failure Swing (fails to make a fresh Lower Low).
  3. Price closes firmly ABOVE the most recent 1-Hour Lower High (Break of Structure).
  4. EXECUTE: Enter Long on the candle close or retest of the broken level.
Step 5: Risk Management & Structural Invalidation
Dow Theory provides unambiguous, non-arbitrary stop-loss levels based on market geometry rather than arbitrary account percentages:
- Stop-Loss Placement: Place the initial stop-loss 1 to 2 ticks below the lowest point of the newly formed Secondary Trough (Higher Low). If price violates this level, the trade thesis is mathematically and structurally invalidated.
- Profit Taking: Scale out at the prior Primary Swing High (first structural target), allowing the remainder of the position to ride the developing primary wave.
- Trailing Strategy: Trail stop-losses beneath each newly confirmed Higher Low on the Daily chart as the primary trend advances.
6. Critical Weaknesses and Contemporary Limitations
While Dow Theory remains a cornerstone of market analysis, relying on it mechanically in modern algorithmic markets presents several challenges:
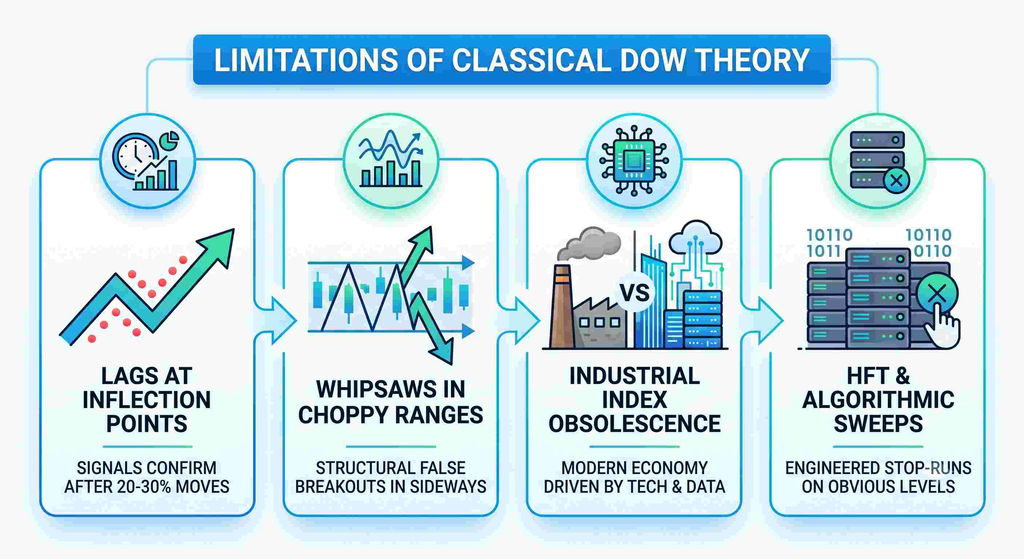
+--------------------------------------------------------------------------+
|                  LIMITATIONS OF CLASSICAL DOW THEORY                     |
|                                                                          |
|  [Lags at Inflection Points]  --> Signals confirm after 20-30% moves     |
|  [Whipsaws in Choppy Ranges]  --> Structural false breakouts in sideways |
|  [Industrial Index Obsolescence]-> Modern economy driven by Tech & Data  |
|  [HFT & Algorithmic Sweeps]   --> Engineered stop-runs on obvious levels |
+--------------------------------------------------------------------------+
1. Significant Inherent Lag
Because Dow Theory demands definitive confirmation across multi-candle swings and companion indices before declaring a trend change, it routinely gives entry signals well after a major reversal has started.
- In a typical market cycle, 20% to 30% of a primary move’s total range may elapse before a secondary failure swing confirms a reversal.
- Solution: Use lower-timeframe market structure breaks to anticipate higher-timeframe confirmations with tighter risk parameters.
2. High Vulnerability in Prolonged Range-Bound Markets
Dow Theory performs best in clear, trending macro environments. During prolonged, sideways consolidation regimes (e.g., multi-month stagflation or range-bound distributions):
- The framework generates repeated false breakouts and whipsaws, as successive minor highs and lows are breached without initiating a sustained primary trend.
- Solution: Recognize range-bound environments early; avoid trend-following systems when indices are bound between established horizontal boundaries.
3. Structural Shifts in the Modern Economy
Dow’s original index pairing (Industrials and Railroads) reflected an early-20th-century physical manufacturing economy.
- Today’s market capitalizations are heavily dominated by technology, software, intellectual property, financial services, and digital platforms.
- Solution: Replace or augment the classic DJIA/DJTA pair with modern sector confirmations (e.g., comparing the S&P 500 with the Nasdaq 100, or tracking the Semiconductor Index [$SOX] as the modern proxy for production logistics).
4. Algorithmic Liquidity Sweeps
Modern High-Frequency Trading (HFT) algorithms and institutional execution desks recognize that retail stop-losses cluster predictably below prior Dow swing lows.
- Markets frequently produce temporary wick penetrations below key structural swing points before reversing aggressively, trapping traders who rely solely on intraday price probes.
- Solution: Always demand a confirmed closing candle (Daily close) beyond the structural swing point before declaring an official invalidation or trend reversal.
7. Comprehensive Dow Theory Cheat Sheet
Keep this reference guide accessible when conducting structural chart analysis:
+------------------------------------------------------------------------------+
|                         DOW THEORY QUICK REFERENCE                           |
+==============================================================================+
| 1. CORE TENETS                                                               |
| • The averages discount everything (all news, data, and sentiment).         |
| • Three trends: Primary (Years), Secondary (Weeks-Months), Minor (<3 Weeks). |
| • Bull phases: Accumulation -> Public Participation -> Euphoria.             |
| • Bear phases: Distribution -> Panic Liquidation -> Discouraged Despair.     |
| • Cross-Index Confirmation: All major indices must confirm new extremes.     |
| • Volume: Expands in direction of primary trend; contracts on pullbacks.     |
| • Inertia: A trend is valid until a structural reversal pattern confirms.    |
+------------------------------------------------------------------------------+
| 2. STRUCTURAL IDENTIFICATION                                                 |
| • Primary Uptrend   = Higher Highs (HH) + Higher Lows (HL).                  |
| • Primary Downtrend = Lower Highs (LH) + Lower Lows (LL).                    |
+------------------------------------------------------------------------------+
| 3. REVERSAL RULES                                                            |
| • Bearish Reversal  = Lower High printed -> Breakdown below prior HL close.  |
| • Bullish Reversal  = Higher Low printed -> Breakout above prior LH close.   |
| • Failure Swing     = Most reliable reversal pattern (no false re-test).     |
+------------------------------------------------------------------------------+
| 4. TRADE MANAGEMENT RULES                                                    |
| • Directional Bias  = Align 100% of trades with the Weekly Primary Trend.    |
| • Entry Zone        = Secondary retracements of 38.2% - 61.8%.               |
| • Structural Stop   = 1-2 ticks below the lowest swing point of the pullback.|
| • Invalidation Rule = Close beyond structural high/low (wicks don't count). |
+------------------------------------------------------------------------------+
8. Summary: Integrating Dow Principles into Modern Trading
Dow Theory is not a rigid trading indicator; it is a foundational philosophy of market behavior. By filtering out minor daily market noise and anchoring execution to higher-timeframe swing geometry, you eliminate the emotional traps that derail most traders:
- Trade With the Tide: Never fight the Primary Trend. Long setups belong in bull structures; short setups belong in bear structures.
- Demand Objective Proof: Require both structural confirmation (Higher Highs / Lower Lows) and cross-index alignment before committing major capital.
- Let Structure Dictate Risk: Define entries, stop-losses, and profit targets strictly around objective market inflection points rather than arbitrary rules.
Mastering these foundational rules equips you to read price action in its purest form, giving you a timeless framework to trade stocks, commodities, and derivatives with structured confidence.
Suyesh Gusain is a NISM-certified Research Analyst (Series XV) and Equity Derivatives trader (Series VIII), as well as Director at Wisdomganga. Combining a background in Physics and Mass Communication, he writes on advanced technical analysis, market microstructure, and digital fraud prevention to provide clear, actionable financial education.